
How to Calculate Safety Stock Using Standard Deviation
One of the core principles in business management is acknowledging how important your inventory is to keep your company strong and successful. A well-stocked and smoothly running inventory increases customer satisfaction, business growth, and revenue. A high inventory level can be significantly beneficial for your business. On the other hand, running out of stock is bad for your business and, most importantly, for your customers. Wrong inventory planning can lead to missed sales opportunities and a damaged reputation. Businesses have a vital ally in the form of safety stock to avoid these unwanted situations.
This article helps you to learn everything you need to know about safety stock and how to calculate it using standard deviation for your inventory levels. Before diving into exploring how to calculate safety stock. It’s useful what the term safety stock means.
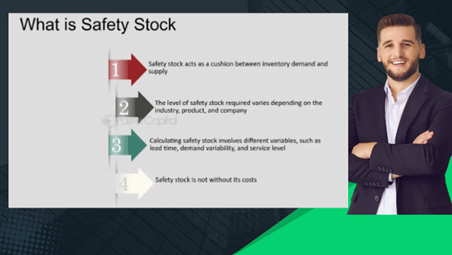
What is Safety Stock?
The additional inventory that a company keeps to avoid running out of products is called safety stock. This extra stock helps the company deal with unexpected delays from suppliers or sudden increases in customer demand. By having safety stock, the company can continue to meet customer needs and avoid stopping production or sales, ensuring everything runs smoothly.
Formula to Find Out Safety Stock
To determine the units or value of safety stock involves different factors such as demand variability, desired service level, and lead time we want to achieve. The formula to calculate safety stock can vary based on the approach, but one common method is to use the below formula.
Safety Stock =Z × ?LT ?× ?LT
Where:
- Z is the Z-score, representing the desired service level (the number of standard deviations above the mean demand).
- ?LT? is the standard deviation of demand during the lead time.
- LT is the lead time that is taken in week, month, quarter or annually, etc.
How to Calculate Safety Stock?
We might think we can guess how much extra stock we need to keep things running smoothly, but that’s risky. If we don’t calculate our safety stock properly, we could be out of stock. The amount of stock shows how much lead time will be enough to meet our expected demand. So, how do we calculate the safety stock?
Let’s break it down.
The equation of safety stock using standard deviation looks like: Z × ?LT × ?LT.
It may look complicated but we can do it easily with a few below steps. let’s get started.
Step 1: Calculate Standard Deviation of Lead Time
Lead time is the duration between initiating and completing a process. This timeframe can include steps like submitting purchase requests, getting approvals, communicating with vendors, shipping time, conducting incoming inspections, and shelving the products.
If our lead time is always the same, meaning the time it takes to reorder and restock never changes, we can skip to the next step in the safety stock calculator. But since this is rare, we’ll usually need to calculate the standard deviation of our lead time to get an accurate measurement for varying lead times.
We need 3 important points to calculate: the expected time, the actual time, and the variance. They are defined as follows:
- Expected time: The projected lead time for a product.
- Actual time: The real duration taken to replenish each order.
- Variance: The discrepancy between the actual time and the expected time.
To find the value of standard deviation use the following mathematical formula.
?LT = ?(variance)
Variance = ?2=1/n??i=1n?(Xi???)2
Where:
- “Xi” represents each individual data point.
- “n” shows total numbers in data set.
- “?” is the mean (average) of the data points that can be find by below formula.
? = ?i=1n?Xi?/n
If we have positive numbers in our variance category, they signify the number of days over the expected times If we have negative numbers in the category, then the delivery reached earlier than the expected time. We can calculate the standard deviation for the lead time.
Step 2: Determine the Lead time
Finding the lead time for calculating the value of safety stock involves a slightly different focus than just determining lead time in general. The lead time for safety stock considers both the variability in demand and the variability in lead time itself. Collect historical data on each component of the lead time for a significant period (e.g., past 6 months to a year) and Track the variability (standard deviation) of each component if possible.
Step 3: Establish desired service level
Before determining safety stock, we need to consider the Z-score. To determine the z-score use the normal distribution table and get the z-value with respect to the service percentage level. To get this right, we must balance the cost of holding inventory against the cost of running out of stock.
Now, we have our lead time,standard deviation for the respective lead time, and desired service level. Let’s solve an example to gain more understanding of these steps.
Example To calculate safety stock using Standard deviation
Here we solved the related problem to find the safety stock by using the standard deviation and the lead time of the project.
Example:
Determine the appropriate safety stock level for a product that helps the company to manage the inventory of its products by analyzing the weekly demand data of the past 10 weeks. The demand data in units as follows: 50, 60, 55, 70, 65, 60, 75, 80, 55, and 65, with a consistent lead time of 2 weeks and aiming for a 95% service level.
Solution:
Step 1: Note the data from the above statement and Set the data of weekly demand for the past 10 weeks.
Lead time = 2 weeks, service level = 95%
| Week | Demand (Units) |
| 1 | 50 |
| 2 | 60 |
| 3 | 55 |
| 4 | 70 |
| 5 | 65 |
| 6 | 60 |
| 7 | 75 |
| 8 | 80 |
| 9 | 55 |
| 10 | 65 |
Step 2: First find the Standard Deviation of the lead time.
?LT = ?(variance)
To find the standard deviation of the lead first calculate the variance by finding the squared deviations from the mean of the data set. The formula of the variance can be stated as:
Variance = ?2=1/n??i=1n?(Xi???)2
Mean (Average) Demand:
Mean = (50 + 60 + 55 + 70 + 65 + 60 + 75 + 80 + 55 + 65) / 10
= 635 / 10
Mean = 63.5 units per week
Variance = ?2= 1/n??i=1n?(Xi???)2
Variance = [(50-63.5)² + (60-63.5)² + (55-63.5)² + (70-63.5)² + (65-63.5)² + (60-63.5)² + (75-63.5)² + (80-63.5)² + (55-63.5)² + (65-63.5)²] / 10
Variance = [182.25 + 12.25 + 72.25 + 42.25 + 2.25 + 12.25 + 132.25 + 272.25 + 72.25 + 2.25] / 10
Variance = 804.50 / 10
Variance = 80.45
?LT = Standard deviation = ?80.45
= 8.97 units
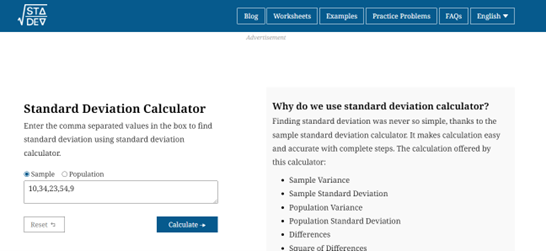
To overcome from the lengthy and manual calculation of standard deviation for lead time using the online standard deviation calculator for quick and accurate calculations or save your time.
Step 3: Now, find the Service Level using the normal distribution table.
The Z-score for a 95% service level = 1.65.
Step 4: Use the all above values in the Safety Stock formula and simplify to calculate its value.
Safety stock = Z × ?LT × ?Lead time
= 1.65 × 8.97 × ?2
= 1.65 × 8.97 × 1.414
Safety stock = 20.91 units
Thus, for a 95% service level with a lead time of 2 weeks, the safety stock should be approximately 21 units (rounded to the nearest whole number).
Conclusion
in this article, We explored the importance of safety stock in inventory management and how to calculate it using standard deviation. We explored the formula and steps to calculate safety stock. Additionally, discussed how to evaluate the lead time variability and the desired service level for the given stock. In the end, we solved the example to gain a better understanding of this topic.